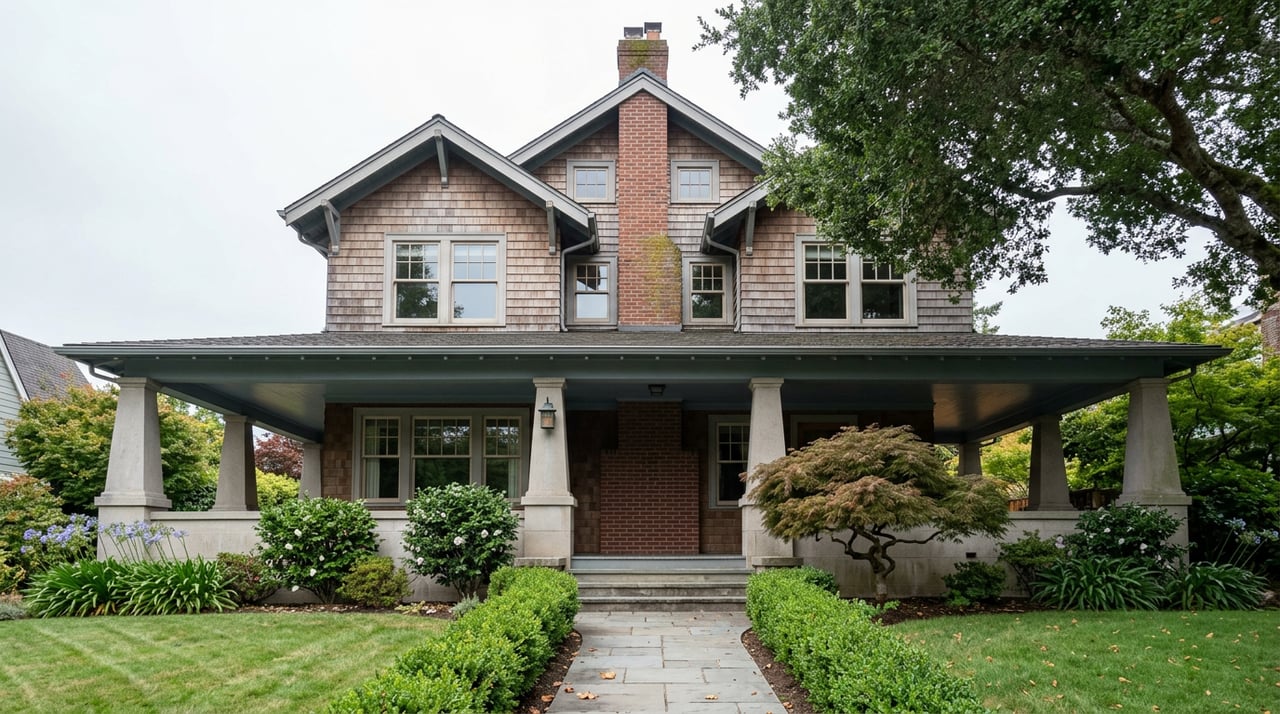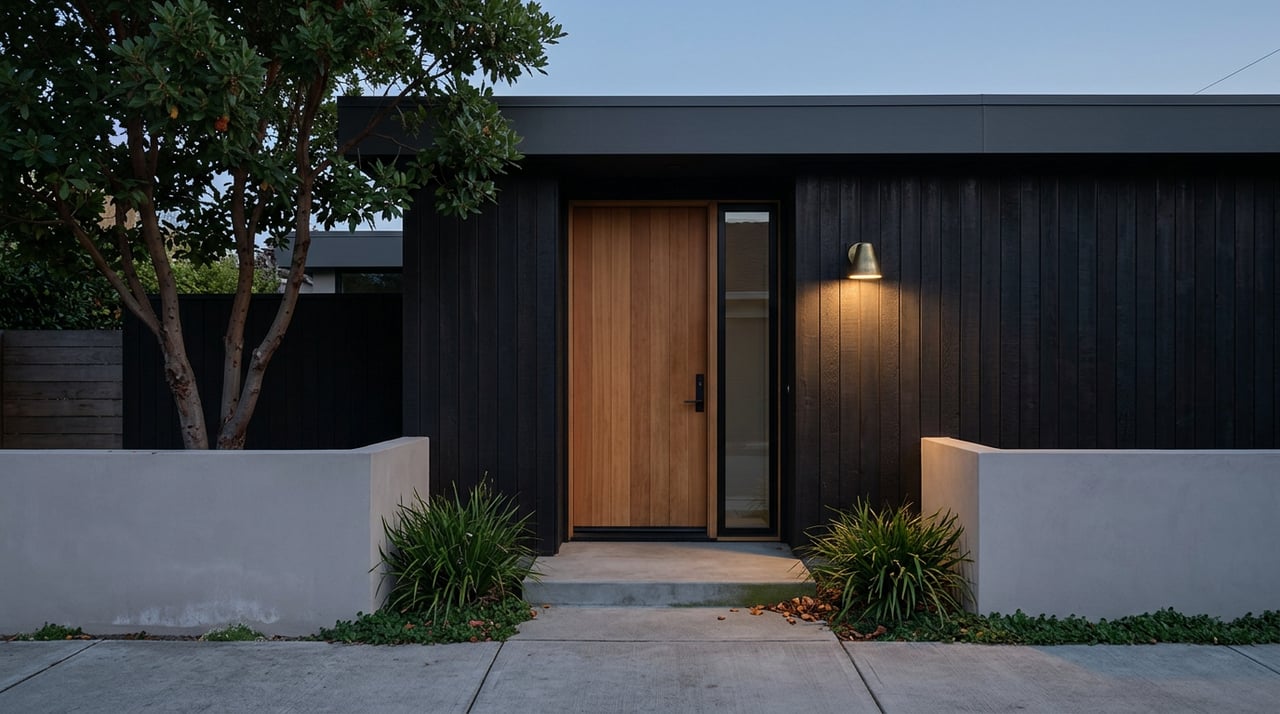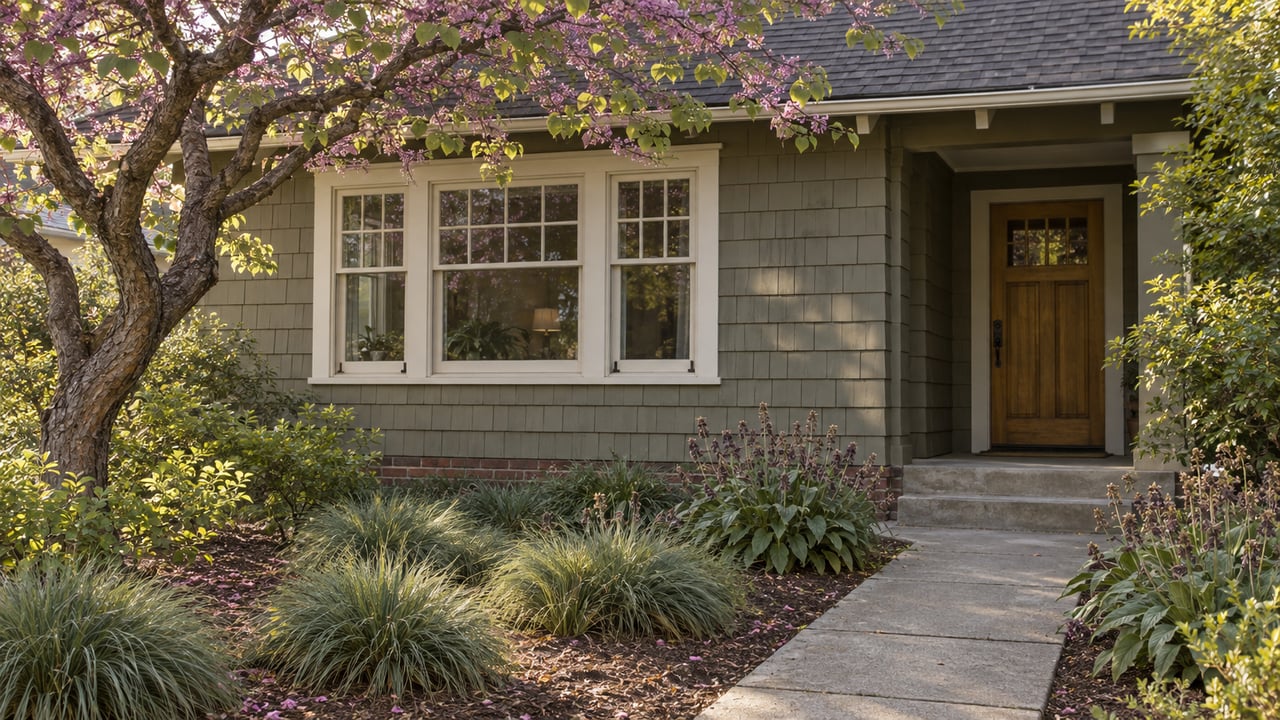
Ask three different sources what a home in Rockridge costs this year and you will get three different answers, and none of them agree by less than a few hundred thousand dollars. One Oakland market report published in March 2026 called $1.6 million "jumbo territory" for Rockridge. By July, a neighborhood-ranking site had the median at $2.09 million. Redfin's own three-month window ending in August 2026 put it at $1.9 million, down 10.1 percent from the year before. Same neighborhood, same calendar year, a swing of nearly half a million dollars depending on when you looked and which methodology you trusted.
That is not a data error. It is what happens when a premium micro-market changes hands one house at a time.
The number that keeps moving
Rockridge and Temescal sit next to each other in North Oakland, close enough that the Rockridge-Temescal Greenbelt, known locally as Frog Park, physically connects them and blurs the border on a handful of blocks. Both draw buyers who want a BART-adjacent commute and a walkable commercial strip. Both get treated in casual conversation as Oakland's most expensive corner of the map.
But "most expensive" assumes a stable price, and a stable price assumes enough transactions to average out. Redfin logged only 5 home sales in Rockridge in August 2026, down from 8 the year before. Homes there took an average of 20 days to sell, up from 14 days a year earlier. Five sales is not a market. It is five negotiations, five sets of sellers, five sets of buyers, and whatever they happened to agree on that month becomes the headline median for the entire neighborhood.
Temescal's sales count runs just as thin. Redfin's December 2025 snapshot showed 7 homes sold, up from 6 the year before, at a median of $1.0 million. Zillow's home value index, updated through June 2026, put the typical Temescal home closer to $1,068,900, essentially flat over the prior year. Those two numbers land within about $70,000 of each other, which sounds like agreement until you remember Rockridge's own sources disagreed by seven times that amount over the same stretch of months.
What one side-by-side comparison actually showed
A comparison of the two neighborhoods using Redfin data from March 2026 found something that contradicts the assumption most buyers walk in with. Rockridge carried a higher price per square foot, which fits its reputation. But Temescal's median sale price edged slightly ahead of Rockridge's in that same snapshot. The neighborhood usually described as the pricier of the two was not, at least not on that particular measure, in that particular month.
This is not proof that Temescal has quietly overtaken Rockridge. It is proof that with sale counts this small, rank order between two adjacent, similarly priced neighborhoods is not a fixed fact. It is closer to a coin that can land either way depending on which handful of homes closed escrow that quarter.
For context on scale, Oakland citywide sold 787 homes in August 2026, according to Redfin, at a median of $809,000, up 6.5 percent year over year, with a median price per square foot of $535. That is enough volume for a median to mean something close to what people assume a median means. Rockridge and Temescal, at a combined dozen or so sales in a typical month, do not have that luxury.
The corridors, not the label
If the neighborhood name itself is not a reliable price signal, something else has to do the work of explaining why one block trades differently than another three streets over. That something is usually the commercial corridor and the transit stop a buyer actually uses.
Rockridge centers on College Avenue and Rockridge BART, at 5660 College Avenue, with a retail strip that reads as residential and quiet once you step off the main street. Temescal centers on Telegraph Avenue between roughly 40th and 51st Streets and MacArthur BART, a stretch with more mixed-use density and more street life at the edges. Both areas are, per the same March 2026 lending report, at the upper end of Oakland's price range, with that report placing Fruitvale's median near $545,000 at the city's other end of the spectrum, entry-level and FHA-eligible territory by comparison.
Buyers deciding between Rockridge and Temescal are not really deciding between two medians. They are deciding between a College Avenue routine and a Telegraph Avenue routine, and between which BART platform they want to be underground beneath most mornings. That choice does not show up in a median at all.
A closer look at the same summer, three ways
| Source and date | Rockridge figure | What it measured |
|---|---|---|
| Lending market report, published March 2026 | $1.6 million+ | Described as "jumbo territory," a general price-band characterization |
| Redfin, three months ending August 2026 | $1.9 million median, down 10.1% YoY | Rolling three-month median sale price, 5 homes sold in August |
| Neighborhood-ranking index, as of July 2026 | $2.09 million median | Full 12-month price history, up about 1.2% from $2.06 million |
Three snapshots inside a single calendar year, three different numbers, none of them wrong exactly, all of them measuring something slightly different at a slightly different moment.
What to actually check before comparing the two
A single median, from any one source, is close to useless for a decision this size. A few things hold up better.
- Look at price per square foot over a six-month trend, not one month's median. It smooths out the effect of one unusually large or small house closing.
- Track days on market alongside price. Rockridge's jump from 14 to 20 days between the same August windows a year apart says as much about buyer demand as the price figure does.
- Ask your agent for sales within a quarter mile of the specific address, not the broader neighborhood polygon. Rockridge and Temescal's shared border blocks near Frog Park can price closer to each other than either does to its own neighborhood's edge.
- Weigh the corridor you will actually use daily. College Avenue and Telegraph Avenue offer genuinely different day-to-day textures, and that difference is durable in a way a monthly median is not.
Common questions about Rockridge and Temescal pricing
Why does the "pricier neighborhood" answer keep changing? Because both neighborhoods see single-digit monthly sales, one unusually large or small closing can shift the median enough to flip the ranking between them. A stable answer would require far more transactions than either neighborhood typically produces in a given month.
How many homes actually sell in these neighborhoods each month? Redfin recorded 5 Rockridge sales in August 2026 and 7 Temescal sales in December 2025. Both counts are small enough that a single high or low sale can move the reported median meaningfully.
Is there a real boundary between Rockridge and Temescal? Not a rigid one. The Rockridge-Temescal Greenbelt, known as Frog Park, sits between them, and blocks near that border often carry a blended feel rather than a clean line between the two.
Choosing between Rockridge and Temescal is really a choice between two corridors, two BART stops, and two everyday rhythms, not between two fixed price tags. If you want the actual comps behind a specific address in either neighborhood, and a read on what a listing's price per square foot is really telling you, Homes by Karthiga can walk through the numbers block by block before you make an offer.